Showing posts with label Performance Tuning. Show all posts

Friday, May 2, 2014

Video: SQL Server Performance Tuning with Wait Statistics (CXPACKET)

CXPACKET is a common wait type, resulted by parallel query execution. But does occurrence of CXPACKET wait is always a sign of performance problem???
A lot more written. But here is our second animated video to learn it in a very simple way.


Sunday, April 6, 2014

Video: SQL Server Performance Tuning with Wait Statistics (Introduction)

To investigate performance bottleneck, Wait Statistics is a power full tool which a DBA like to use on priority. Understanding waits is not that difficult but the way books and blog entries describe, makes it more complicated.
This is first out of 5 videos series. A simple way to understand internals of WAITS and how they can effectively be used to resolve SQL Server performance problems.


SQL Server Performance Tuning with Wait Statistics (Introduction) from aasim abdullah on Vimeo.

Sunday, December 22, 2013

Microsoft Innovation Center: Presentation Dec 18 2013

On December 18th, 2013, I have presented on topic "*SQL Server: Query Performance Tuning" at Microsoft Innovation Center, Lahore (Pakistan). Primary agenda was to discuss all possible methods to detect costly queries and handling these queries to obtain optimum performance. 

Wednesday, January 2, 2013

SQL Server: A Query Slow in SSMS, Fast in Application, WHY?


Today, a colleague asked me, why his simple select query is taking around 3000ms (3 Seconds) to execute while, same query is quite fast when executed from application.

Answer is simple: SQL Server Management Studio use RBAR-Row By Agonizing Row method to fetch rows and inform row by row to SQL Server that row is received while on other hand application which don’t use RBAR method, inform once after whole batch is received and reluctantly is fast as compared to SSMS or those applications which use RBAR method.

To confirm that query is running slow just because of RBAR factor, I have used extended events for single session waits analysis, a well defined method by Paul Randal. Output was as following: 

 NETWORK_IO is basically ASYNC_NETWORK_IO, when working with extended events. According to BOL “Occurs on network writes when the task is blocked behind the network. Verify that the client is processing data from the server.”

But a more proper definition for this type of wait you can find on Karthik PK’s Blog. He stats that “When a query is fired, SQL Server produces the results ,place it in output buffer and send it to client/Application. Client/Application then fetch the result from the Output buffer, process data  and sends an acknowledgement to SQL Server. If client/Application takes long time to send acknowledgement then SQL Server waits on ASYNC_NETWORK_IO (SQL 2005/2008) or  Network_IO (SQL 2000) before it produces additional results.

Hence proved that, our query delay was just because of NETWORK_IO wait (2870ms out of total 3000ms) and we were on the same machine where SQL Server was installed so no chances of any network problem and its only RBAR method of SQL Server Management Studio which was causing this delay. 

Wednesday, November 28, 2012

SQL Server: CMEMTHREAD, High Wait Values and Solution


Wait stats is the first place when where we start analyzing health of a production database server. Recently, we have found that a new database production server is not performing up to mark and queries response getting slower and slower in peak hours.
On executing, well known query by Paul Randal to get wait stats, we have found that a time for strange wait “CMEMTHREAD” is too high for said server.


According to BOL “CMEMTHREAD, occurs when a task is waiting on a thread-safe memory object. The wait time might increase when there is contention caused by multiple tasks trying to allocate memory from the same memory object.”
On trying a lot, but totally in vain, I thought asking Paul Randal would be better, as his blog on SQLSkills is one of the big resources from where I have learned about waits and wait types. Paul replied that “My guess is ad hoc plans being inserted into the plan cache. Try turning on 'optimize for ad hoc workloads'.” (That’s what we have already tried)
Skimming through articles and forums, I came a across to Microsoft support team article http://support.microsoft.com/kb/2492381/en-us. Which stats that, it could be occurring due to a bug in SQL Server 2008 R2. On said production server, we have found that NO service pack is installed and it still contains RTM.
Without any second thought we have created a ticket for upgradation to ServicePack2 and after that we have found that problem is resolved and server start working normally.

Monday, November 19, 2012

SQL Server: Indexes List With Key and Involved Columns Name Alongwith Usage Statistics

A year back I have shared a script from query bank, which can be helpful to get indexes list of a database, with key and involved columns. Being a DBA, I never remember a day, without using this script. 
Getting detail of indexes on a database most of the time I also need indexes usage statistics, through which I can figure out which indexes are being used and which indexes can be discarded. 
To avoid to use two separate scripts, let me share following script which brings both, usage and structural information for all indexes of a database or a given table.


Script output

User Seek +  User Scans will decide which index are useful and which are just burden for database. Indexes with less seek + scan should be removed for better DML operations performance.

Friday, September 28, 2012

SQL Server: Why a Session With sp_readrequest Takes so Long to Execute


While applying, Long Running Sessions Detection Job on a production server, we start receiving alert that a session is taking more then 3 minutes. But what actually this session was doing. Here is the alert report.

SP ID
Stored Procedure Call
DB Name
Executing Since
58
msdb.dbo.sp_readrequest;1�
msdb
3 min
sp_readrequest is a system stored procedure, which basically reads a message request from the the queue and returns its  contents.
This process can remain active for a time we have configured for parameter DatabaseMailExeMinimumLifeTime, at the time of database mail profile configuration. 600 seconds is the default value for this external mail process. According to BOL DatabaseMailExeMinimumLifeTime is the The minimum amount of time, in seconds, that the external mail process remains active.
This can be changed, at the time of mail profile configuration or you can just use update query to change this time.

UPDATE msdb.dbo.sysmail_configuration
SET paramvalue = 60 --60 Seconds
WHERE paramname = 'DatabaseMailExeMinimumLifeTime'
We have changed this to 60 seconds to resolve our problem.

Wednesday, September 5, 2012

SQL Server: Automatically Detect and Kill Long Running Sessions on Production Servers


Problem:  On production servers, how to detect long running sessions and kill them automatically if they are exceeding a specific amount of time.
Solution:
Solution to this problem is very simple. Just create a job, which will detect long running sessions by running query against sys.sysprocesses executing SP_WHO or sp_WHO2 and then kill those sessions which are exceeding a time limit. BUT major problem is that SP_WHO or SP_WHO2 are unable to provide important information, like actually which execution command, stored procedure call or tsql batch is being executed by this culprit session? To avoid, in future and to find out permanent solution for such long running quires we need to mail them before we kill these sessions.
Following is the script we like to use on production servers, to find out costly sessions and send complete information to DBA team through mail, before killing these costly processes, automatically.


Mail output would be as following.

Friday, August 24, 2012

SQL Server: Why We Should Avoid NOLOCK Table Hint in DELETE/UPDATE Queries

Recently, I was asked to review, already written stored procedures for optimization purpose. During this review process I have found that a group of developers is regularly committing a big mistake. This group of developers believes that table hint NOLOCK is used to execute queries quickly, as this hint will avoid placing any lock on target table records and it can you used in any query. Even they have applied this NOLOCK in DML statements.
WRONG
First thing, NOLOCK hint means, it will not take care of any lock (instead of placing lock). It will return data, that could be dirty (NOT YET COMMITTEED by other transactions). We can use this table hint to get results quickly when we are dead sure that dirty data is TOTALLY bearable.
In DELETE/UPDATE queries it should be totally avoided as it can produce junk results. Let’s prove.
In following example, we need to correct discount column of SalesOrderDetail, but according to discount provided in lookup table of SpecialOffer. Before we execute our update statement (Statement #2 in Transaction# 2), someone has accidently changed SpecialOffer, but good thing is that, he has not committed these changes yet. But as we have placed NOLOCK hint in our Statement #2 in Transaction# 2, it will change data according to dirty data, though, later on transaction#1 is rolledback.


Tuesday, July 24, 2012

SQL Server has encountered 1 occurrence(s) of cachestore flush


SQL Server Log report from one of our production server was continuously showing following messages.
Log Date
Process Info
Process Text
2012-07-23T20:00:08.880
spid17s
SQL Server has encountered 1 occurrence(s) of cachestore flush for the 'Bound Trees' cachestore (part of plan cache) due to some database maintenance or reconfigure operations.
2012-07-23T20:00:08.880
spid17s
SQL Server has encountered 1 occurrence(s) of cachestore flush for the 'SQL Plans' cachestore (part of plan cache) due to some database maintenance or reconfigure operations.
2012-07-23T20:00:07.190
spid17s
SQL Server has encountered 1 occurrence(s) of cachestore flush for the 'Object Plans' cachestore (part of plan cache) due to some database maintenance or reconfigure operations.
2012-07-23T06:00:04.640
spid16s
SQL Server has encountered 1 occurrence(s) of cachestore flush for the 'Bound Trees' cachestore (part of plan cache) due to some database maintenance or reconfigure operations.
2012-07-23T06:00:04.640
spid16s
SQL Server has encountered 1 occurrence(s) of cachestore flush for the 'SQL Plans' cachestore (part of plan cache) due to some database maintenance or reconfigure operations.
2012-07-23T06:00:04.580
spid16s
SQL Server has encountered 1 occurrence(s) of cachestore flush for the 'Object Plans' cachestore (part of plan cache) due to some database maintenance or reconfigure operations.

It happens when you configure user database with Auto Close option.
SQL Server, close a user database automatically, when last session is closed and reactivated when a login request is received.  We must keep this option OFF for a better performance. Why so read this.

Tuesday, July 10, 2012

SQL Server: How Local Variables Can Reduce Query Performance

It’s a common practice by database developers to use local variables in stored procedures and scripts to place filter on basis of these local variables. YES, these local variables can slowdown your queries. Let’s prove it.
Create a new table and insert dummy rows.

USE AdventureWorks
GO
CREATE TABLE TempTable
      (tempID UNIQUEIDENTIFIER,tempMonth INT, tempDateTime DATETIME )
GO

INSERT INTO TempTable (tempID, tempMonth, tempDateTime)
SELECT NEWID(),(CAST(100000*RAND() AS INT) % 12) + 1 ,GETDATE()
GO 100000 -- (EXECUTE THIS BATCH 100000 TIME)

-- Create an index to support our query
CREATE NONCLUSTERED INDEX [IX_tempDateTime] ON [dbo].[TempTable]
([tempDateTime] ASC)
INCLUDE ( [tempID]) WITH ( ALLOW_ROW_LOCKS  = ON, ALLOW_PAGE_LOCKS  = ON) ON [PRIMARY]
GO
Now let’s execute a simple query with hard coded values in WHERE clause

SET STATISTICS IO ON
GO
SELECT * FROM TempTable
WHERE tempDateTime > '2012-07-10 03:18:01.640'
-------------------------------------------------------------------------------------------
Table 'TempTable'. Scan count 1, logical reads 80, physical reads 0, read-ahead reads 0, lob logical reads 0, lob physical reads 0, lob read-ahead reads 0.

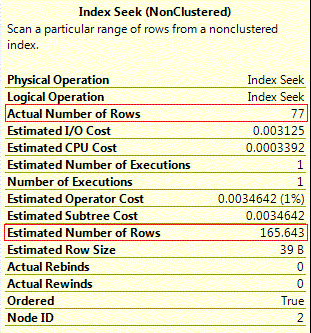
Check out its execution plan and index seeks properties. You can find that estimated rows are double to actual rows but that’s not a big difference to affect execution plan and resultantly optimizer has selected a proper plan to execute this query.

Query optimizer has estimated number of rows from its base statistics histogram i.e.  EQ_ROWS + AVG_RANGE_ROWS (77 + 88.64286)
DBCC SHOW_STATISTICS ('dbo.TempTable', IX_tempDateTime)

Now, let’s modify our SELECT query and use local variable and execute it. You will find that query optimizer has selected a different plan this time, a more costly plan. WHY ??
DECLARE @RequiredDate DATETIME
SET @RequiredDate = '2012-07-10 03:18:01.640'

SELECT * FROM TempTable
WHERE tempDateTime  > @RequiredDate
------------------------------------------------------------------------------------------
Table 'TempTable'. Scan count 1, logical reads 481, physical reads 0, read-ahead reads 0, lob logical reads 0, lob physical reads 0, lob read-ahead reads 0.

Huge difference of estimated and actual number of rows clearly indicating that query optimizer was unable to proprly estimate number of rows and with this wrong estimation, it has selected a more costly execution plan. Basically Query Optimizer does not know the value of local variable at the time of optimization and resultantly can’t use histogram of statistics. It behaves differently with inequality and equality operators.
In Case of Inequality Operator:
In our case of inequality operator in query, query optimizer used a simple formula of 30% of total rows.

Estimated Rows =(Total Rows * 30)/100 = (100000*30)/100 = 30000

 In Case of Equality Operator:
DECLARE @RequiredDate DATETIME
SET @RequiredDate = '2012-07-10 03:18:01.640'

SELECT * FROM TempTable
WHERE tempDateTime  = @RequiredDate

If equality operator is used with local variables, query optimizer gets estimated rows figure from a different formula i.e.  Density * Total Number of Table Rows. Execute following query to get density value.
DBCC SHOW_STATISTICS ('dbo.TempTable', IX_tempDateTime)

All Density = 0.0007358352
Total Number of Rows in Table = 100000
Estimated Rows = Density * Total Number =  0.0007358352 *  100000 = 73.5835

Drop table when not required
DROP TABLE TempTable

Thursday, July 5, 2012

SQL Server: Smarter Way of Query Load Testing at Testing Server

Most import decision by Database Administrator is that a query on development server, where only hundred or thousand of rows exists, can also perform flawless according to given benchmarks when we will deploy same query on production server, where number of rows could be in millions.

One solution is to insert millions of rows in testing environment and then check execution plan. But it’s really painful.

Thanks to SQL Server, which has provided a better solution, since SQL Server 2005. Yes, you can test a query that base table contains only dozen of rows but can act like they have million of rows (or as much as you want). Let’s try with a simple query at Adventure Works.

SELECT  p.ProductID, p.Name, pm.Name AS ProductModel, pmx.CultureID,
        pd.Description
FROM    Production.Product AS p
        INNER JOIN Production.ProductModel AS pm
        ON p.ProductModelID = pm.ProductModelID
        INNER JOIN Production.ProductModelProductDescriptionCulture AS pmx
        ON pm.ProductModelID = pmx.ProductModelID
        INNER JOIN Production.ProductDescription AS pd
        ON pmx.ProductDescriptionID = pd.ProductDescriptionID
WHERE   pm.Name = 'Road-150'

How many rows each table (in above query) contains, check with following query.

SELECT OBJECT_NAME(object_id),rows FROM sys.partitions
WHERE object_id IN
(object_id('Production.ProductModel'),
object_id('Production.ProductModelProductDescriptionCulture') ,
object_id('Production.ProductDescription') ,
object_id('Production.Product'))        
AND index_id = 1

On execution of first query, you can find that in execution plan, SQL Server Optimizer took number of rows estimate from its table statistics and its showing correct estimated and actual number of rows.

Now we will deceive SQL Server Optimizer for number of rows of 'Production.Product' table. Simple use following update statistics BUT with undocumented options i.e. ROWCOUNT and PAGECOUNT
 UPDATE STATISTICS Production.Product WITH ROWCOUNT = 10000000, PAGECOUNT = 1000000
Execute our first SELECT query but withDBCC FREEPROCCACHE” and it will show a different execution plan, as SQL Server Optimizer thought now number of rows are 10000000.
Now we have a better picture, that what will be the execution plan if number of rows are increased to 10000000 and it will be helpful to place new indexes and to take deceision like applying partition scheme.

To restore, actual number of rows, just rebuild all indexes on 'Production.Product' table.
ALTER INDEX ALL ON Production.ProductDescription REBUILD

Note: Don’t use this method on production server.

Wednesday, May 30, 2012

SQL Server has encountered occurrence(s) of I/O requests taking longer than 15 seconds to complete


This morning, while going through my regular SQL Server Logs reports, for one of our production server, I found a different error.
SQL Server has encountered 52 occurrence(s) of I/O requests taking longer than 15 seconds to complete on file [E:\Program Files\Microsoft SQL Server\MSSQL.1\MSSQL\DATA\TempDB.mdf] in database [TempDB] (2). The OS file handle is 0x00000884. The offset of the latest long I/O is: 0x00000457490000
First thing that I searched about this error was that is this a critical message?
And answer I found was YES. Basically when talk about I/O in SQL Server, we always have measurements of mille seconds in our mind and waits of several seconds is considered too odd. SQL Server I/O wait time can be examined by following query:
SELECT  *
FROM    sys.dm_os_wait_stats
WHERE   wait_type LIKE 'PAGEIOLATCH%'

How to check you hard drive performance?
To check, server IO subsystems I trust on Performance Monitor IO Counter PhysicalDisk Object: Avg. Disk Queue Length. Monitor this counter for at least 10 minutes. If the Avg. Disk Queue Length exceeds 2 for next ten minutes for each individual disk drive in an array, then it is sure that you have IO bottleneck.


Who is the culprit, SQL Server or Operating System?
Problem is only your SAN or Local disk IO subsystem. In my case, I found that few other applications were also installed by client on same drive and which were pushing SQL Server to wait for too long to complete its IO requests.

Monday, May 28, 2012

SQL Server: Too High Difference in CPU and Elapsed Time (Duration) , Don’t Blame IO Every Time


There could be different causes behind too high difference in CPU and Elapsed Time (Duration) value for a query executed by SQL Server.  One of the most common reasons is IO problem.  This can easily be observed by executing following query:
SELECT  *
FROM    sys.dm_os_wait_stats
WHERE   wait_type LIKE 'PAGEIOLATCH%'
If number of waits and average wait time is too high then there is something wrong on IO side. To get the root cause, you have to check different things like queries without proper indexes (high page read by queries), pressure on TempDB side, hard drive and memory performance etc.
Normally when you are facing up to two times higher elapsed time value as compared to CPU then IO waits could be a cause, but what if your query elapsed time is 5, 10 or more times high. 
Recently on one of our production server, a query gave me amazing time stats.


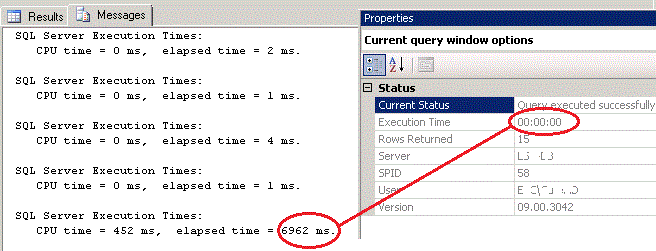
I know it’s a simple query, indexes are properly applied and it return results with fast response. Query executed under 1 sec of response time (SSMS properties can show up to seconds), but Time Stats showing that query elapsed time is more than 6 Seconds.
Why this happening:
This happened because my production server CPUs counter are not synchronized with each other. It could be confirmed from SQL Server Log. (SQL Server 2005 Service Pack 2 and higher edition show this message)
The time stamp counter of CPU on scheduler id 13 is not synchronized with other CPUs.
Good thing is that, there is nothing wrong with your SQL Server performance and everything will work fine. Only problem you can face is that, your performance tuning process will be affected as you can’t collect correct information regarding query execution time.
This basically happens when you make changes in power polices or install utilities that can affect CPU performance and can try to resolved it by setting you machine, power options to “Always On” or “Max Performance”. If it doesn't work for your, then better try to install Service Pack 3 for SQL Server 2005.


------------------------------------------------------------------------------------
Read More about SQL Server Log Errors/Messages 

Tuesday, January 31, 2012

SQL Server: Idera SQL Doctor

If you don't know much about SQL Server internals and its performance tuning techniques, but still need your SQL Server performance, right upto the mark, then you must try SQL Doctor, a really helpful tool by Idera. 
SQL doctor is a revolutionary technology that analyzes the performance of SQL Server and provides recommendations for improving performance.


Wednesday, June 8, 2011

SQL Server: Does Unwanted Tables in a Query or View Affect Performance

Recently a friend of mine asked, that is it true that presence of extra tables in joins section of a query, will affect query performance. Extra tables means,tables which can be skipped from query without affecting query result. For example following query has extra tables (other than vendor and contact tables) in join section
USE AdventureWorks
GO

SELECT Vendor.Name,
Contact.Title,
Contact.FirstName,
Contact.MiddleName
FROM Person.Address AS a
INNER JOIN Purchasing.VendorAddress AS VendorAddress
ON a.AddressID = VendorAddress.AddressID
INNER JOIN Person.StateProvince AS StateProvince
ON StateProvince.StateProvinceID = a.StateProvinceID
INNER JOIN Person.CountryRegion AS CountryRegion
ON CountryRegion.CountryRegionCode = StateProvince.CountryRegionCode
INNER JOIN Purchasing.Vendor AS Vendor
INNER JOIN Purchasing.VendorContact AS VendorContact
ON VendorContact.VendorID = Vendor.VendorID
INNER JOIN Person.Contact AS Contact
ON Contact.ContactID = VendorContact.ContactID
INNER JOIN Person.ContactType AS ContactType
ON VendorContact.ContactTypeID = ContactType.ContactTypeID
ON VendorAddress.VendorID = Vendor.VendorID
Though this is NOT common to have extra tables in our usual queries but it could be possible in views. A view can be created with multiple tables and selecting columns from each joined table. And later on when we will query this view we can use only few columns in our select statement. So when we will execute above query SQL Server Query Analyzer will skip all those tables which are not part of game. Here is execution plan of above query.


Same query with more columns, pushing all tables in action.

SELECT Vendor.Name,
ContactType.Name AS ContactType,
Contact.Title,
Contact.FirstName,
Contact.MiddleName,
a.AddressLine1,
a.AddressLine2,
a.City,
StateProvince.Name AS StateProvinceName,
a.PostalCode,
CountryRegion.Name AS CountryRegionName,
Vendor.VendorID
FROM Person.Address AS a
INNER JOIN Purchasing.VendorAddress AS VendorAddress
ON a.AddressID = VendorAddress.AddressID
INNER JOIN Person.StateProvince AS StateProvince
ON StateProvince.StateProvinceID = a.StateProvinceID
INNER JOIN Person.CountryRegion AS CountryRegion
ON CountryRegion.CountryRegionCode = StateProvince.CountryRegionCode
INNER JOIN Purchasing.Vendor AS Vendor
INNER JOIN Purchasing.VendorContact AS VendorContact
ON VendorContact.VendorID = Vendor.VendorID
INNER JOIN Person.Contact AS Contact
ON Contact.ContactID = VendorContact.ContactID
INNER JOIN Person.ContactType AS ContactType
ON VendorContact.ContactTypeID = ContactType.ContactTypeID
ON VendorAddress.VendorID = Vendor.VendorID


If we create a view using our second query and use our view in following style then execution plan will be same to our first query.

SELECT Name,
Title,
FirstName,
MiddleName
FROM vw_MyView
Hence, SQL Server Query Analyser is quite smart and work on only those tables which are part of actual game and it doesn’t matter that extra tables are part of your query or a view.